Fantasy Environment Score: Ranking the NFL Offenses Built to Feed Fantasy Points
Fantasy football isn’t just about talent. Situation matters.
An elite player in a great offensive environment will usually outscore an equally talented player stuck in a low-scoring offense. That's why we created Fantasy Environment Score: a market-based metric designed to identify the teams expected to produce the most fantasy points.
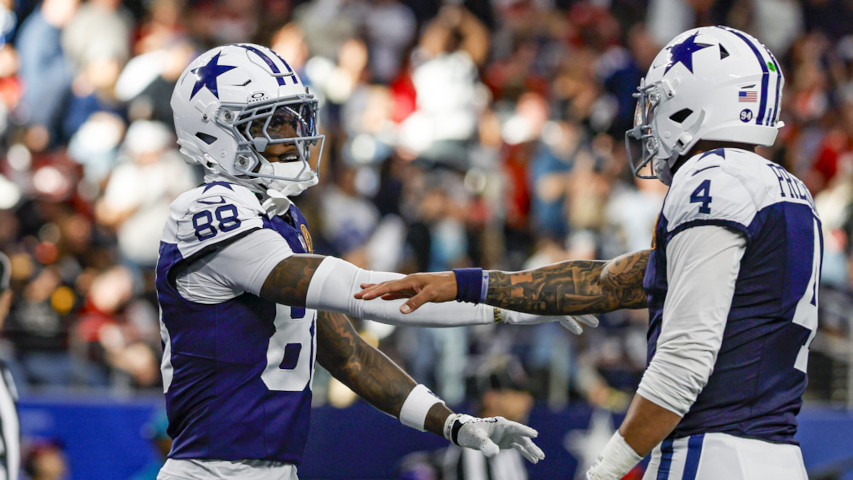
2026's Fantasy Environment Scores will have you pushing Cowboys up your rankings ... and absolutely terrified to draft Jets.
What Is Fantasy Environment Score?
Fantasy Environment Score combines several Vegas-based metrics into a single rating that estimates how favorable each team's offensive environment is for fantasy football scoring.
Rather than relying on projections alone, it uses the betting market's expectations for every game, including:
- Implied points per game
- Opponent implied points
- Average game total
- Average point spread
- Shootout frequency (games projected for 48+ points)
- Low-total game frequency (games projected for 42 points or fewer)
The result is a single number that captures how often a team is expected to play in high-scoring, fantasy-friendly games.
TIP
Fantasy Environment Score is built into our award-winning player rankings.
High Totals Lift Everyone
Players score fantasy points within the context of their offense.
More points mean more TD chances. Higher game totals mean more shootout potential. Better offensive environments can lift everyone.
That doesn’t mean we blindly draft every player on a high-ranking team. But when comparing similarly valued players, Fantasy Environment Score can help break ties.
TIP
High Fantasy Environment Scores can help pinpoint high-upside players in the later rounds of fantasy drafts, a key tenet of the best draft strategy.
2026 Fantasy Environment Scores
| Rank | Team | Fantasy Environment Score |
| 1 | Dallas Cowboys | 3.12 |
| 2 | Cincinnati Bengals | 2.67 |
| 3 | Los Angeles Rams | 2.55 |
| 4 | Detroit Lions | 2.54 |
| 5 | Buffalo Bills | 2.53 |
| 6 | Baltimore Ravens | 2.26 |
| 7 | San Francisco 49ers | 1.58 |
| 8 | Green Bay Packers | 1.36 |
| 9 | Chicago Bears | 1.30 |
| 10 | Washington Commanders | 1.18 |
| 11 | Indianapolis Colts | 0.96 |
| 12 | Seattle Seahawks | 0.79 |
| 13 | Tampa Bay Buccaneers | 0.72 |
| 14 | Jacksonville Jaguars | 0.29 |
| 15 | New England Patriots | 0.23 |
| 16 | Kansas City Chiefs | 0.19 |
| 17 | Los Angeles Chargers | 0.16 |
| 18 | Philadelphia Eagles | 0.13 |
| 19 | New York Giants | -0.39 |
| 20 | Minnesota Vikings | -0.44 |
| 21 | New Orleans Saints | -0.87 |
| 22 | Atlanta Falcons | -0.99 |
| 23 | Houston Texans | -1.15 |
| 24 | Tennessee Titans | -1.34 |
| 25 | Denver Broncos | -1.38 |
| 26 | Carolina Panthers | -1.73 |
| 27 | Pittsburgh Steelers | -1.79 |
| 28 | Arizona Cardinals | -1.93 |
| 29 | Miami Dolphins | -2.12 |
| 30 | Las Vegas Raiders | -2.86 |
| 31 | New York Jets | -3.76 |
| 32 | Cleveland Browns | -3.82 |
The Best Fantasy Environments
Dallas ranks as the clear No. 1 with a 3.12 Fantasy Environment Score.
The Cowboys are implied for 25.74 points per game, the sixth-highest mark, and are also projected to allow the fourth most points per game.
Fifteen of Dallas’ 17 games carry an over/under of 48+ points. No other team has more than 11 such games.
Expect plenty of fantasy points from the Cowboys this season. And it’s one of the easier offenses to project. HC Brian Schottenheimer's offense will run plenty of plays and lean pass, with the ball going primarily to CeeDee Lamb, George Pickens, and Javonte Williams.
TIP
See where all the Cowboys sit in the updated 2026 fantasy football rankings.
The Bengals check in with the second-highest Fantasy Environment Score.
Like Dallas, Cincinnati combines a strong offense (fourth in implied points per game) with a questionable defense (19th in implied points against).
And, like Dallas, this is a concentrated offense, with Ja’Marr Chase, Tee Higgins, and Chase Brown soaking up most of the fantasy points.
Cowboys and Bengals skill-position players look like some of the safest bets in 2026 fantasy drafts.
The Rams, Lions, and Bills also post strong Fantasy Environment Scores, driven mostly by their own firepower. They own the three highest implied points per game:
- Rams (26.49)
- Lions (26.09)
- Bills (26.06)
Don’t Sleep On These Fantasy Environments
Green Bay, despite a strong projected defense, checks in with the eighth-best Fantasy Environment Score.
The Packers are projected to allow the 11th-fewest points but score the eighth-most. Their projected point differential is the ninth-best.
That suggests plenty of points and positive game scripts, good news for Josh Jacobs or whoever is leading the backfield.
The Commanders crack the top 10 in Fantasy Environment Score, ranking 15th in implied points scored and 30th in implied points against. Eight of Washington’s 17 games have an over/under of 48+ points. That’s tied with the Rams for sixth-most.
That sets up particularly well for Jayden Daniels and Terry McLaurin.
The Colts are perhaps the biggest surprise in these rankings, registering the 11th-highest Fantasy Environment Score.
This setup looks similar to Washington's: Indianapolis is implied for the 16th-most points and the fifth-most points allowed.
That’s promising for the Colts’ passing game but worrisome for Jonathan Taylor, who feasted on positive game scripts to lead all RBs in PPR points per game during his team’s 8-2 start last year. But Taylor plummeted to RB20 as the Colts lost their final 7 games.
This year’s Colts are favored in 10 of 17 games, so this doesn’t project to be a bad team. But it probably won’t be as dominant as it was over the first half of last season. And that’s worrisome for Taylor’s fantasy outlook.
The Worst Fantasy Environments
The Browns and Jets own, by far, the two worst Fantasy Environment Scores.
The Browns have the third-lowest implied points scored (18.76) and the lowest average game total (41.32). Eleven of their 17 games have an over/under of 42 or fewer points, and none has an over/under of 48+.
This offense has serious issues, and the defense remains solid despite the loss of Myles Garrett. Expect plenty of ugly, low-scoring Browns games with little fantasy goodness.
The Jets also have 11 games with an over/under of 42 or fewer and none at 48+. They’re tied for the lowest implied points (18.56) and own the second-lowest average game total (41.97).
The Dolphins and Raiders also rank bottom five in both Fantasy Environment Score and implied points scored.
The Cardinals check in with the fifth-worst Fantasy Environment Score. Their 18.56 implied points per game are tied with the Jets for lowest in the league. But Arizona is somewhat saved by a league-worst 27.0 implied points against per game.
Like last year, the Cardinals figure to spend plenty of time chasing this season. That should help passing volume, even if the offense is expected to struggle to put points on the board.
Use The Market To Your Advantage
Fantasy Environment Score adds useful context by highlighting the teams most likely to score points and get into shootouts, along with the ones likely to do neither.
When two players are similarly valued, lean toward the one attached to the better offensive environment.
For 2026, that means giving extra weight to players from the Cowboys, Bengals, Rams, Lions, and Bills. Be very careful drafting guys from the Browns, Jets, Dolphins, Raiders, and Cardinals.
The Components Of Fantasy Environment Score
For reference, the table below shows many of the key metrics included in Fantasy Environment Score:
- Implied points per game
- Average game total
- Shootout Rate (% of games with over/under of 48+ points)
- Low Total Rate (% of games with over/under of 42 or fewer points)
| Team | Implied Points Per Game | Average Game Total | Shootout Rate | Low Total Rate |
| Cowboys | 25.74 | 50.32 | 88.2% | 0.0% |
| Bengals | 25.97 | 49.09 | 64.7% | 0.0% |
| Rams | 26.49 | 48.50 | 47.1% | 0.0% |
| Lions | 26.09 | 48.62 | 58.8% | 0.0% |
| Bills | 26.06 | 48.62 | 58.8% | 0.0% |
| Ravens | 25.93 | 47.97 | 52.9% | 0.0% |
| 49ers | 25.16 | 47.56 | 29.4% | 0.0% |
| Packers | 24.93 | 47.03 | 29.4% | 0.0% |
| Bears | 24.53 | 47.50 | 29.4% | 0.0% |
| Commanders | 23.38 | 48.21 | 47.1% | 0.0% |
| Colts | 23.37 | 47.85 | 35.3% | 0.0% |
| Seahawks | 24.82 | 45.62 | 11.8% | 0.0% |
| Buccaneers | 23.34 | 46.85 | 35.3% | 0.0% |
| Jaguars | 23.26 | 46.15 | 29.4% | 11.8% |
| Patriots | 23.76 | 45.21 | 17.6% | 5.9% |
| Chiefs | 24.03 | 45.21 | 11.8% | 11.8% |
| Chargers | 23.74 | 45.32 | 17.6% | 11.8% |
| Eagles | 23.97 | 45.03 | 11.8% | 11.8% |
| Giants | 22.03 | 46.03 | 17.6% | 11.8% |
| Vikings | 22.53 | 45.09 | 5.9% | 5.9% |
| Saints | 21.49 | 44.85 | 11.8% | 5.9% |
| Falcons | 21.16 | 45.38 | 17.6% | 17.6% |
| Texans | 22.74 | 43.44 | 0.0% | 29.4% |
| Titans | 20.65 | 44.79 | 17.6% | 17.6% |
| Broncos | 22.40 | 43.09 | 0.0% | 29.4% |
| Panthers | 20.69 | 43.91 | 0.0% | 17.6% |
| Steelers | 21.43 | 43.44 | 0.0% | 35.3% |
| Cardinals | 18.56 | 45.56 | 11.8% | 5.9% |
| Dolphins | 19.03 | 44.91 | 5.9% | 17.6% |
| Raiders | 19.13 | 42.97 | 0.0% | 35.3% |
| Jets | 18.56 | 41.97 | 0.0% | 64.7% |
| Browns | 18.76 | 41.32 | 0.0% | 64.7% |